

New satellite data shows NZ’s major cities are sinking – meaning rising seas will affect them sooner
- Written by The Conversation
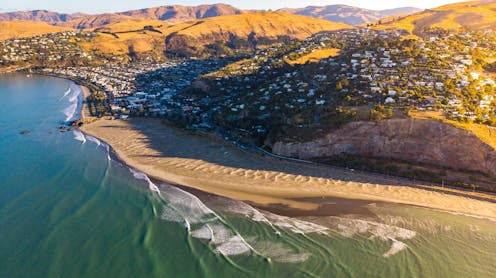
Rising seas are already affecting coastal communities in Aotearoa New Zealand. On a global average, the sea level is now 18 centimetres higher than it was in 1900, and the annual rate of increase has been accelerating to currently 4.4 millimetres per year.
This may not seem much, but it is already amplifying the impact of storm and tidal surges. Over the coming decades and centuries, this will pose increasingly serious problems for all coastal communities.
But this is not the end of our troubles. Some parts of New Zealand’s coastline are also sinking. In many New Zealand cities, shorelines are steadily subsiding, with growing impacts on coastal infrastructure.
Our new research reveals where and how fast this is happening. We found the coastlines near all major cities in New Zealand are sinking a few millimetres each year, with some of the fastest rates in coastal suburbs of Christchurch, where the land is still adjusting to the impact of the 2011 earthquake.
Relative increase in sea level
Sea-level rise is happening globally because the ocean is expanding as it continues to warm and glaciers and polar ice sheets are melting.
Meanwhile, land subsidence operates on regional or local scales, but it can potentially double or triple the effects of sea-level rise in certain places. This dual effect of rising seas and sinking land is know as relative sea-level rise and it gives coastal communities a more accurate projection of what they need to prepare for.
To understand which parts of the coast are most at risk requires detailed and precise measurements of land subsidence. The key to this is to observe Earth from space.
We have used a technique known as interferometric synthetic aperture radar (InSAR). This involves the repeat acquisition of satellite radar images of the Earth’s surface, tied to very accurate global navigation satellite system measurements of ground stations.
This builds on earlier work by the NZSeaRise project, which measured vertical land movement for every two kilometres of New Zealand’s coastline. Our study uses a significantly higher resolution (every ten metres in most places) and more recent datasets, highlighting previously missed parts of urban coastlines.
Urban hotspots
For instance, in Christchurch the previous NZSeaRise dataset showed very little subsidence at Southshore and New Brighton. The big differences in the new data are not due to the increase in spatial resolution, but because the rate of vertical land movement is very different from the time prior to the 2011 earthquake.
Localised subsidence in these Christchurch suburbs is up to 8mm per year, among the fastest rates of urban subsidence we observed. These areas sit upon natural coastal sand dunes above the source area of the earthquake and the Earth’s crust is still responding to that sudden change in stress.
We have tracked vertical movement of the land with millimetre-scale precision for five major cities in New Zealand. The InSAR technique works particularly well in urban areas because the smooth surface of pavements, roads and buildings better reflects the satellite radar beam back into space where it is picked up by the orbiting satellite.
This means the estimates of relative sea-level rise for these cities are close to or above 7mm per year. If sustained, this amounts to around 70cm of sea-level rise per century – enough to seriously threaten most sea defences.
Our new satellite measurements provide a detailed picture of urban subsidence, even within single suburbs. It can vary by as much as 10mm per year between parts of a city, as this map of Dunedin and the Otago Harbour shows.
We found hotspots of very rapidly sinking regions. They tend to match areas of land that have been modified, particularly along the waterfront. During the 20th century, many acres of land were reclaimed from the ocean, and this new land is still compacting, creating an unstable base for the overlying infrastructure.
One example of this is in Porirua Harbour, where a section of reclaimed land near the mouth of Porirua Stream is sinking at 3–5mm per year. This is more than double the average rate for Porirua’s coast.
Paradoxically, perhaps, it is only by looking back on our planet from outer space that we can begin to see with sufficient detail what is happening to the land in our own backyard.
The good news is that we can use the results to identify coastlines that are particularly vulnerable to sea-level rise and plan accordingly for any future development. Our new measurements are just the first step in what must become a major effort to watch the ups and downs of our coastlines and urban areas.


